Coronavirus: Are cases in England really slowing?

The latest REACT report, the biggest regular study of COVID-19 infection rates in England, seems to provide some much-needed good news. The authors of the report suggest that a combination of national measures and local lockdowns may have played a role in slowing down the spread of the virus.
Daily case numbers in England are still increasing, but at a slower rate. The all-important R number may have fallen from a high of 1.7 in late August to a current value of 1.1, although there is significant uncertainty around both numbers.
Between September 18 and 26, the REACT researchers at Imperial College London randomly selected more than 84,000 people across the country to test. Of those swab tests, 363 came back positive, suggesting more than 400,000 infections in England. This represents roughly one in 140 people, which is a significant increase from the roughly one in 800 people found to be infectious in the previous edition of the study a month earlier. Although the deceleration of the spread is a positive step, the numbers still reflect a worryingly high prevalence of coronavirus in the community.
The report also highlights that virus prevalence has increased across all regions and all age groups in recent weeks. This will inevitably lead to more hospitalisations and eventually to deaths over the weeks to come.
It might seem counter-intuitive that R can be falling, which appears to be good news, yet the number of daily cases is still increasing, which is definitely bad news.
R is the number of new infections that a single infected person will pass the disease to, on average, during their infectious period. If R is above 1, then each new infection spawns at least one other and the epidemic continues to grow. R gives us a measure of how quickly the disease can spread through the population. The REACT report suggests that R has fallen from 1.7 to 1.1, which is good news, but as long as the value of R remains above one, the number of infected people will continue to increase.
This fall in the rate of spread is consistent with other data sources from which we can estimate the rate of growth of the epidemic. Hospital admissions, for example, have shown a fall in the rate of growth in recent days, suggesting a reduction in the rate of transmission compared with a week or so earlier. The increases in the number of calls to NHS and emergency services have also been slowing in recent days.
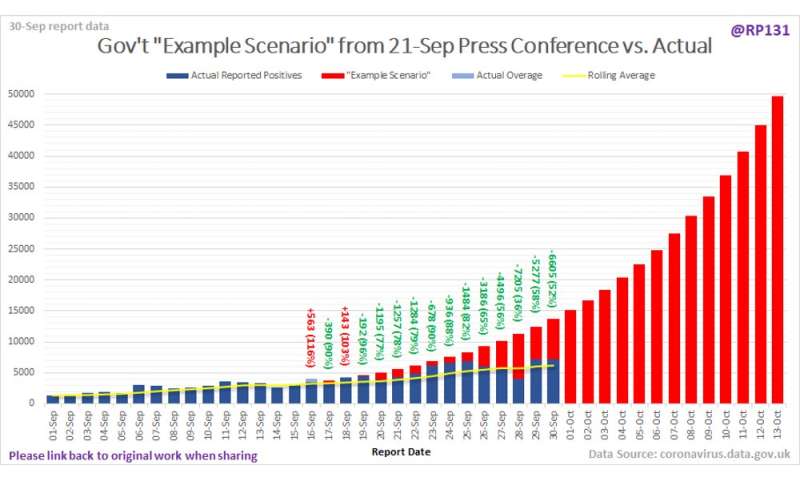
Much was made, at the time, of the stark projection illustrated by Sir Patrick Vallance, the government’s chief scientific adviser, at a briefing earlier in September. The apocalyptic graphic suggested that, if the current growth in cases continued, the UK could be facing 50,000 new cases a day by mid-October. However, the rise in case numbers, although significant, does not appear to support this projection—showing a slower rate of growth in line with the REACT study.
Ironically, it may have been precisely this reinforced message that contributed to the public’s renewed compliance with social distancing, hand-washing and the wearing of face coverings and had an effect on slowing the spread—a happily self-defeating prophecy.
Which data?
Of course, there are caveats about all data sources from which we can estimate rates of growth of the epidemic. Cases give us the most up-to-date picture of what’s happening, but with delays in processing and difficulties in getting tests, case data is perhaps not the most reliable source. Hospitalisations seem a more trustworthy indicator—we don’t miss too many of the people who really need to go to hospital—but there is a lag, typically over a week, between contracting the virus and needing hospitalization.
There are also arguments about whether people have been admitted because of COVID or simply tested positive after finding themselves in hospital with some other illness. Deaths seem to be the most reliable indicator—it should be quite clear whether someone has died or not—but even with this metric, there has been controversy over how long after testing positive someone can be said to have died from COVID.
Restricting these figures to deaths within 28 days of a positive test has removed much of the potential for overcounting (potentially tipping the balance towards undercounting), but there is still a big lag between cases and deaths, which means death data doesn’t paint an up-to-date picture.
REACT is often viewed as an authoritative measure because of the sheer number of people it samples, but the study has its own issues. Data is sampled for short periods of time (known as rounds) rather than continuously, which means we don’t have a good picture of what’s happening in the intervening periods between rounds.
Fitting independent rates of growth to the individual rounds of data shows a drop in R from the start of September to the end of the month. However, assuming the rate of growth is constant between the testing periods gives a similarly good fit and suggests that R could have been steady at around 1.5 throughout September. The data is variable, and it’s inadvisable to draw too firm a conclusion based on one study in isolation.
Source: Read Full Article