The Difference Between the Oris Cell Migration Assay and the Scratch Assay

Cell migration is an essential part of a range of physiological processes, for example, embryonic development, wound healing, and tissue regeneration. Cell migration is also linked to tumor metastasis and atherosclerosis.1 The scratch assay is one of the most commonly used assays in the study of cell migration in vitro.
Performing a scratch assay involves creating a cell-free gap – or ‘scratch’ – on a confluent cell monolayer. Cells at the edge of the opening will move inward to close the scratch, allowing cell migration to be assessed through a comparison of images acquired as the scratch is created and at user-defined intervals as the scratch closes.
The scratch assay is inexpensive and easy to perform, but methods for creating the scratch often differ between labs, meaning that this method can be highly variable. Additional complications arise from the scratch formation process, which has been shown to cause damage to the underlying extracellular matrix (ECM).2
The Oris™ Cell Migration Assay (CMA) has been developed to address the limitations of the scratch assay. The Oris™ CMA (Figure 1) utilizes a 96-well plate that has been populated with silicone stoppers. These stoppers are designed to exclude cells from the well’s central detection zone.
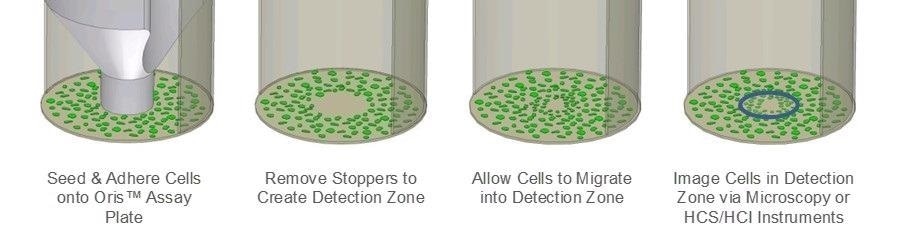
Figure 1. Schematic of Oris Cell Migration Assay. Image Credit: Platypus Technologies, LLC
Once cells have been seeded and given time to adhere, the silicone stoppers will be removed, therefore revealing an unseeded region in each well’s center. Cells will then migrate into these regions.
The use of uniformly sized detection zones means that assay reproducibility is improved in the Oris™ CMA when compared to that of the scratch assay. Furthermore, the silicone stopper does not cause any damage to the underlying ECM.
This article offers a direct comparison of the Oris™ CMA and the scratch assay in terms of cell migration assessment. ECM integrity is also evaluated in both assay formats.
Materials and Methods
Steps for the Oris™ CMA and the scratch assay were all performed in parallel. Steps were also performed on the same day.
Oris™ Cell Migration Assay
Each individual well of a 96-well Oris™ TC plate was coated with 9 µg/mL collagen I (Trevigen). The wells were incubated overnight at 37 °C and 5% CO2 before being rinsed.
Oris™ Cell Seeding Stoppers were inserted and MDA-MB-231 human breast epithelial cells (2000 cells/100 µL) were seeded into each of the Oris™ assay plate’s test wells.
As soon as the confluent monolayer was formed, cells were serum-starved for 24 hours. All stoppers were removed, and media was replaced with serum-containing media.
Next, a Zeiss Axiovert microscope with an attached CCD camera was used to capture phase images. This was done immediately following stopper removal in order to accurately document cell-free detection zone’s pre-migration area.
Finally, the Oris™ assay plate was placed at 37 °C / 5% CO2 to allow cell migration to take place.
Scratch Assay
Each well of a Costar® 6-well plate was coated with 9 µg/mL collagen I (Trevigen). The plate was incubated overnight at 37 °C / 5% CO2. Wells were then rinsed, and MDA-MB-231 cells (500000 cells/2 mL) were seeded into each of the Costar® plate’s individual wells.
Once the confluent monolayer had formed, cells were serum-starved for 24 hours, then cell monolayers were scratched using a 1000 µL pipette tip before serum-containing media was added to each individual well.
A standard Sharpie marker was used to create a reference point in each well, close to the scratch. Phase images of each scratch were acquired in order to document the cell-free detection zone’s pre-migration area.
The scratch assay plate was placed at 37 °C / 5% CO2 to allow for cell migration – the same conditions as the Oris™ assay plate.
After a 24 hour period, the test wells of both the Oris™ assay plate and scratch assay plate were fixed with 0.25% glutaraldehyde. Phase images were then acquired in each assay, documenting a series of migration time points.
The same region of the scratch from the pre-migration image was imaged. This was determined using the reference point.
Cell migration in each assay format was evaluated by measuring the pre-migration area of the detection zone and measuring corresponding migration time-points using ImageJ v1.42l analysis software.3 Cell migration is given as percent closure and has been calculated via the equation below:
((Pre-migration)area – (Migration)area ) x 100 / (Pre-migration)area
ECM Integrity Assay
In order to test the integrity of each assay’s ECM, 100 µg/mL of Collagen Type I – FITC conjugate (Sigma-Aldrich) was coated onto wells of an Oris™ assay plate (without stoppers) and a Costar® plate. These plates were then incubated overnight at 37 °C / 5% CO2.
After incubation, stoppers were inserted into the Oris™ assay plate while sterile PBS was added to both assay plates’ wells. At 1 hour, 24 hour, and 48 hour intervals post-insertion, stoppers were removed before fluorescence images were acquired using a Zeiss Axiovert inverted microscope.
Scratches were made in the Costar® plate at each time point. Images were acquired using the same settings employed for the Oris™ assay plate.
Results
MDA-MB-231 cell migration was contrasted on collagen I coated surfaces. This was done using two migration assays; the Oris™ CMA and the scratch assay. Four different experiments were conducted in parallel on different days in order to compare each assay’s performance.
For each independent experiment, the average area closure attained by the Oris™ CMA (Figure 2A and B) was found to be between 87% and 89% with a coefficient of variance between 3.7% and 6.5% (Figure 2E).
The average area closure attained by the scratch assay (Figure 2C and D) was found to range between 69% and 77% with a coefficient of variance between 11.3% and 25.6% (Figure 2E).
These results confirm that the Oris™ CMA is able to provide more consistent results and improved reproducibility between experiments when compared against the results acquired via the scratch assay.
Cell migration in the scratch assay was consistently less than cell migration observed in the Oris™ assay (Figure 2E). The reduced amount of cell migration in the scratch assay could be a result of damage caused to the ECM as the scratch was formed.
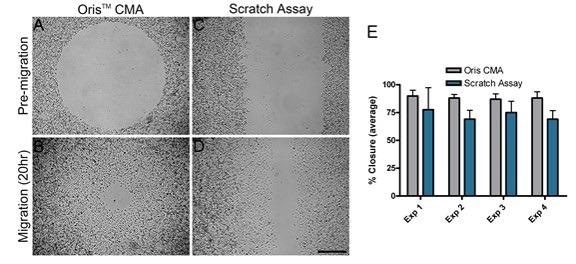
Figure 2. Comparison of cell migration using the Oris™ CMA and the scratch assay. Representative phase images of pre-migration (A and C) and migration after 20 hours (B and D) in the Oris™ CMA (A and B) and the scratch assay (C and D). Scale bar = 500 µm. 2E. Graph comparing cell migration using the Oris™ CMA and scratch assay (performed in parallel over four separate experiments, Exp 1-4). Data are presented as average percent closure ± SD (n≥12). Image Credit: Platypus Technologies, LLC
Kam et al. also demonstrated that the ECM might become damaged during scratch formation.2 To assess whether or not this occurred within this study, an evaluation was conducted into the integrity of the collagen coating after stopper removal and scratch formation.
It was confirmed that the Oris™ Cell Seeding Stopper did not negatively impact the collagen coating, and this was indicated by the presence of uniform fluorescence across the image field (Figure 3A).
The use of assay plates coated with FITC-labeled collagen I coupled with the scratch formation process was found to damage the collagen coating.
This was in line with published findings (Figure 3B)2 and these results indicate that damage to the underlying collagen coating could contribute to the reduction in cell migration noted when utilizing the scratch assay.
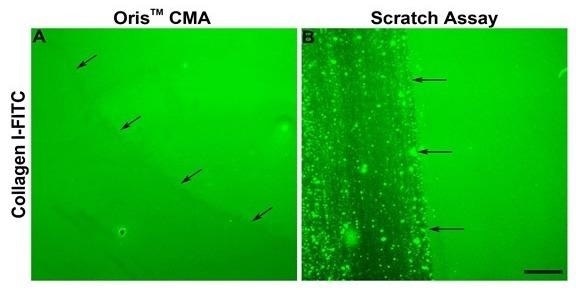
Figure 3. Comparison of the effects of the Oris™ CMA and the Scratch Assay on ECM integrity.Representative images of FITC-labeled collagen I (Collagen I-FITC) after stopper removal from Oris™ CMA plates (A) and following scratch formation in scratch assay plates (B). Arrows indicate the edge of the stopper or scratched region. Scale bar = 100 µm. Image Credit: Platypus Technologies, LLC
Conclusions
This article compared the performance of the Oris™ Cell Migration Assay with the more commonly used scratch assay.
The results presented here confidently demonstrate that the Oris™ CMA facilitates more consistent results between experiments while simultaneously enabling greater reproducibility when compared with the scratch assay.
The use of a silicone stopper in the Oris™ CMA does not damage the underlying ECM, unlike the mechanical scratch formation employed by the scratch assay. These results clearly show the advantages of the Oris™ CMA over the scratch assay in terms of reproducibility and the maintenance of ECM integrity.
References
1. Horwitz R and Webb D. (2003). “Cell migration”. Current Biology. 13:R756-759. Link
2. Kam Y, Guess C, Estrada L, Weidow B, Quaranta V. (2008). “A novel circular invasion assay mimics in vivo invasive behavior of cancer cell lines and distinguishes single-cell motility in vitro”. BMC Cancer. 8:198. Link
3. Hulkower and Gehler. “How to Measure Area Closure Using the OrisTM Pro Cell Migration Assay.” https://www.platypustech.com. Platypus Technologies, LLC. Web. May 14, 2010. Link
![]()
This information has been sourced, reviewed and adapted from materials provided by Platypus Technologies, LLC.
For more information on this source, please visit Platypus Technologies, LLC.
Source: Read Full Article