Specialists create software to study the spatial distribution of COVID-19


Specialists from several centers, including the University of Valencia, have developed customized software that makes it possible to study the spatial distribution of the COVID-19 pandemic online. The tool works by tracking patients in space and time and thus facilitates controlling the transmission of the virus and making decisions on eventual area-based confinements.
The research has been published in journal Jama Network Open, from the U.S., and the head author was doctor Carolina Romero, anaesthesiologist from the General Hospital of Valencia and coordinator in Innovation and Digitisation management of the SEDAR (Spanish Society of Anaesthesia, Reanimation and Pain Therapeutics).
The person working on behalf of the University of Valencia was doctor Adina Iftimi, from the Department of Statistics and Operative Research of the Faculty of Mathematics. Alongside Adina was professor José de Andrés, head of the department of Anaesthesia, Reanimation and Pain treatment of the Hospital General.
The team produced a map of the health department of the hospital, which tends to approximately 364,000 people, listing the clinical and monitoring data from patients, creating time series. This information cannot be shown openly as it contains confidential data from patients.
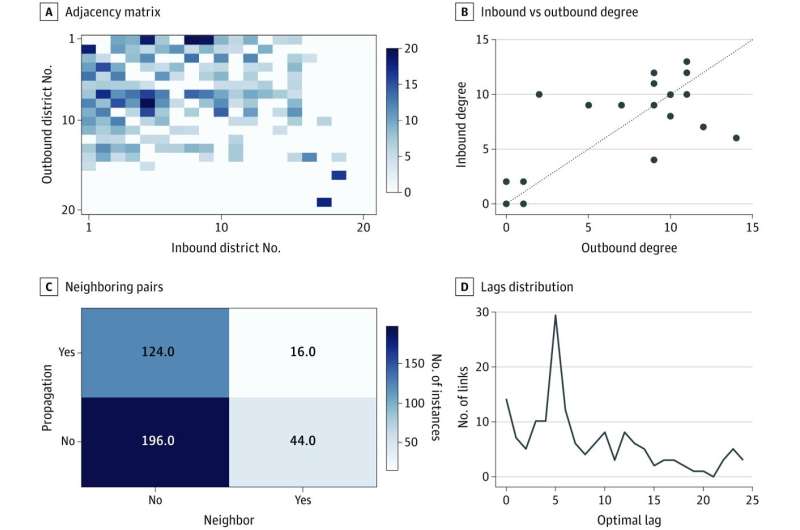
According to Carolina Romero, the work was performed via complex functional networks and a space-time model that includes variables such as the density of the population and the weather of each city, which made it customized.
The software program designs non-obvious COVID-19 transmission patterns and, from a map that shows each patient, shows how the disease is transmitted in a given area, whether there have been outbreaks and to selectively block cities to break the “transmission chain” of a certain disease.
This is the first study with these characteristics in the world, according to the researcher, who explains that it allows them to see in a theoretical way whether there are “hot areas,” in certain districts or locations of the city where the rate of transmission is greater, and where a confinement should be made to only slow down these areas, which are key or strategic links of each city.
Thus, the software takes into account spaces such as the hospital, old people’s homes or schools in the area, which is where there are the most people and where cases can accumulate, as well as taking into account underground stations.
“We cannot say that there is causality, or that it is definitive. It is just a first hypothesis that had never been considered. We have close to 3,000 cases, but it should be tested on a larger number of people and in more hospitals to be able to validate or refute our hypothesis,” she adds.
The online space and time patient tracking software, created due to the emergence of COVID-19, which forwarded trends towards digitisation, also takes into account variables such as the weather, temperature, per capita income or the density of the population.
Although it was created to track people with COVID, patients with other pathologies can also benefit from the program, as well as those who have undergone outpatient surgery or people with reduced mobility, as it is a telemedicine system that brings them closer to the hospital and makes it possible to check their evolution in a structured way, although so far it is just a prototype in the development phase that researchers hope to continue working on.
By filling out a questionnaire over the phone, we can learn whether the recovery is positive or negative using a color-based classification system (green means a good recovery, yellow means it is partial, and orange for a non-suitable recovery), and thus verify the patients’ evolution.
Source: Read Full Article